

Machine learning recovers H II morphology during reionization
The epoch of reionization (EoR) is a unique period of time in cosmic evolution, during which ultraviolet (UV) and X-ray photons emitted from the first luminous objects (e.g. first stars and galaxies) ionize hydrogen atoms first in the surrounding intergalactic medium (IGM) and form bubbles of H II regions, and eventually these H II bubbles fill the whole Universe. The bubble size distribution of ionized hydrogen regions probes the information about the morphology of H II bubbles during the reionization, and it can be derived from the tomographic imaging data of the redshifted 21cm signal.
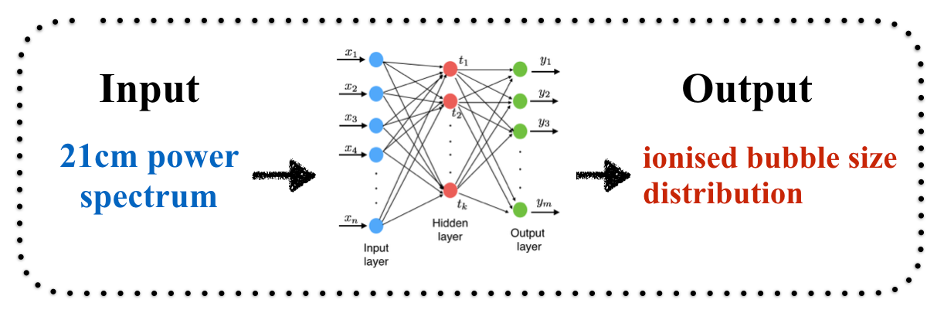
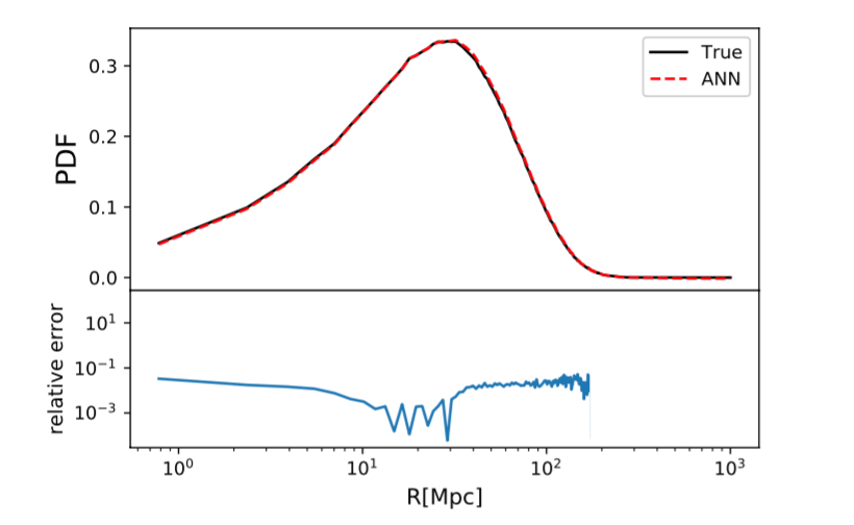
However, 21 cm imaging is observationally very challenging even for the upcoming large radio interferometers. Given that these interferometers promise to measure the 21cm power spectrum accurately, a group of Tsinghua astrophysicists led by Dr. Hayato Shimabukuro and Prof. Yi Mao proposed a new method, which is based on the artificial neural networks (ANN), to reconstruct the H II bubble size distribution from the 21cm power spectrum. The ANN is one of the machine learning approaches (see Figure 1) inspired by human brain structure. It can give approximate functions between input and output data by learning from the training datasets. Shimabukuro et al. demonstrates that the reconstruction from the 21cm power spectrum can be almost as accurate as directly measured from the imaging data with the fractional error ≲ 10%, even with thermal noise at the sensitivity level of the Square Kilometre Array (see Figure 2). Shimabukuro et al. exemplifies the possibility of recovering from the 21cm power spectrum with ANN additional statistics of cosmic reionization that could not otherwise be inferred from the power spectrum analysis directly in the conventional methods.
This work involved Prof. Yi Mao at Tsinghua University, his postdoc Dr. Hayato Shimabukuro (now junior faculty at the SWIFAR of Yunnan University) and his student Jianrong Tan (now a graduate student at the University of Pennsylvania).
Reference:
Hayato Shimabukuro, Yi Mao and Jianrong Tan, arXiv:2002.08238, submitted to MNRAS