

Recovering star formation histories of low-mass galaxies
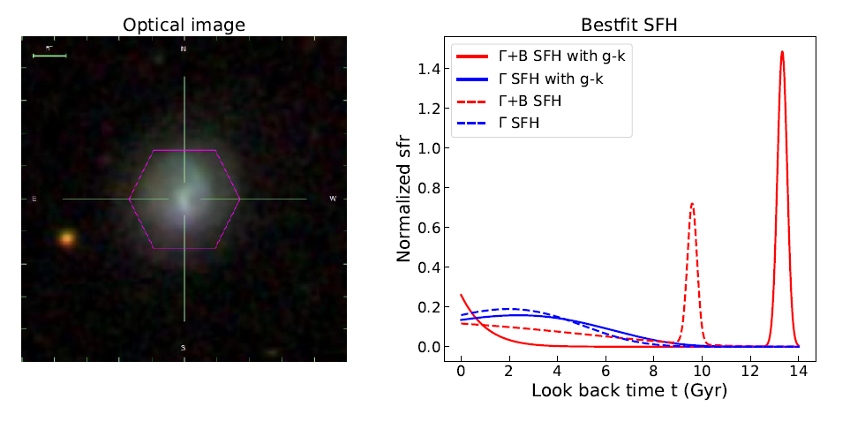
Characterizing the star formation history (SFH) of galaxies is an important step toward a full picture of galaxy formation and evolution. Despite being the most abundant galaxy population in the universe, dwarf (low-mass) galaxies remain elusive as far as their formation and evolution path is concerned. The left panel of Figure 1 shows the optical image of a typical low-mass galaxy observed by the SDSS-IV MaNGA survey. Impressed by their blue color, people have long believed dwarf galaxies are exclusively composed of massive,young stars that are bright, blue, and formed very recently. Recent investigations about low-mass galaxies challenge this stereotype. From ‘archaeological’ age reconstruction of local group dwarf galaxies in which individual stars can be resolved, most stars in these galaxies are found to be older than 5 Gyr, with an age similar to or even older than the Sun. However, the number of dwarf galaxies for which stars can be resolved is very limited, and so it is difficult to draw reliable statistical conclusions.
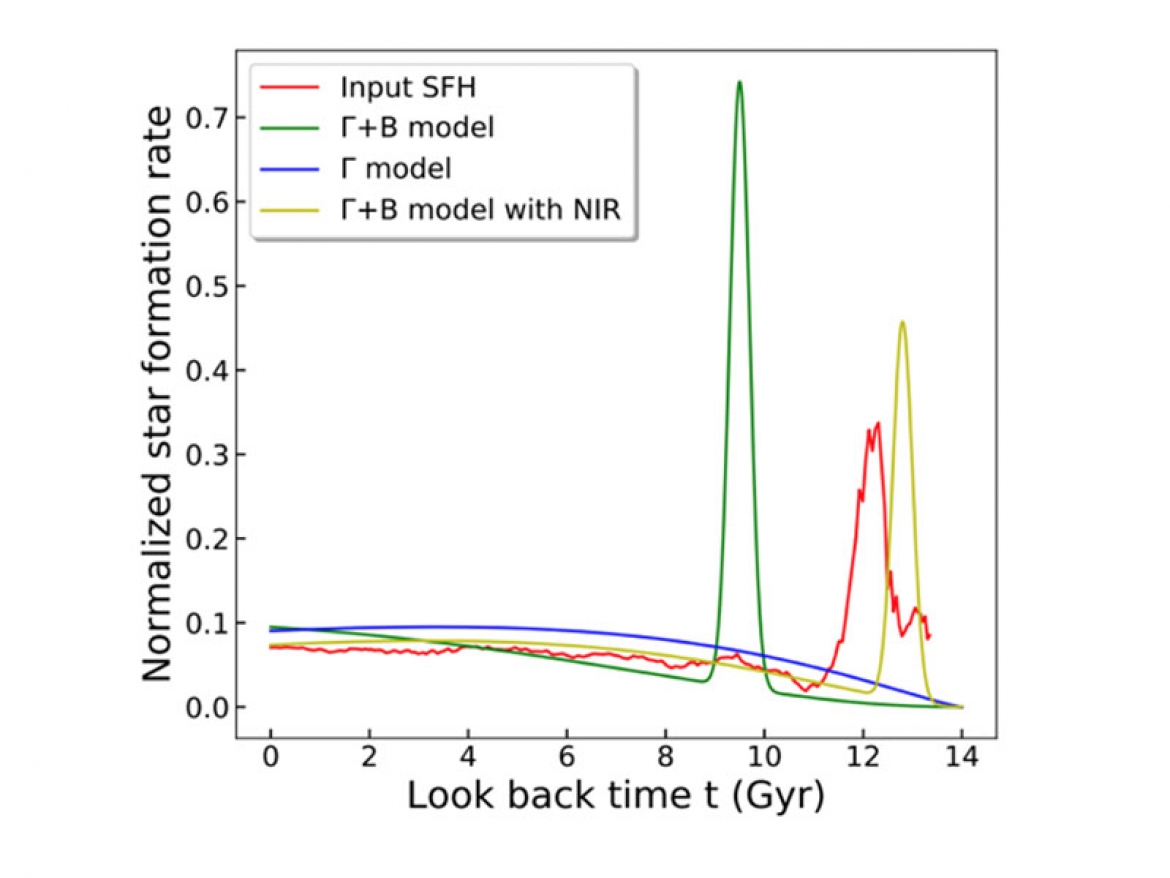
A collaboration led by Dr. Shuang Zhou (Tsinghua), Prof. Cheng Li (Tsinghua) [1] has recently performed an extensive investigation of the SFH of a large sample of low-mass galaxies, using the integral field spectroscopy (IFS) from the ongoing SDSS-IV MaNGA survey, as well as the near-infrared (NIR) photometry data from the UKIDSS survey. To do this, they have developed a new spectral fitting tool which incorporates a Bayesian inference method to statistically explore the posterior distributions of stellar population parameters in the fitting, as well as to distinguish between different SFH models. Applying this tool to the MaNGA and UKIDSS data and adopting SFH models with or without assuming an early star formation burst in the universe (termed as Γ+B model and Γ model), the team certifies the existence of the old stellar populations in the low-mass galaxies and quantifies the variation of the SFH as a function of both environments and the radial distance within galaxies.
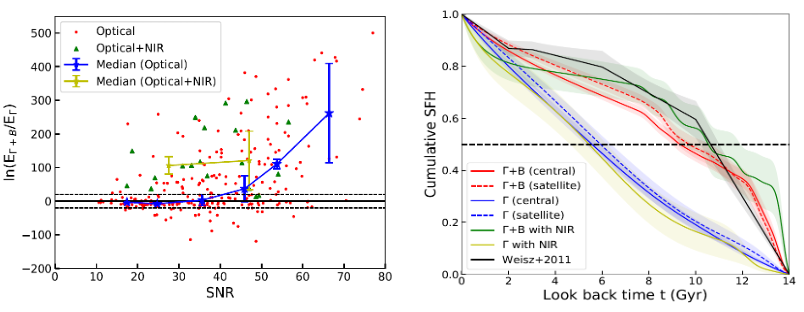
The right panel of Figure 1 shows the best-fit SFHs of the example galaxy in the left panel from different models and datasets. In the context of Bayesian analysis, the Γ+B SFH is found to work increasingly better than the Γ SFH as the SNR of the spectra increases (Figure 2 left panel). Consistent with previous studies, the low-mass galaxies are found to have an early episode of active star formation that produces a large fraction of their present stellar mass (Figure 2 right panel). The addition of NIR photometry to the constraining data can further distinguish between different SFH model families (green triangles in Figure 2 left panel) and enlarge the predicted fraction of the old stellar populations (green line in Figure 2 right panel).
Link to relevant publications:
[1] Shuang Zhou, et al., 2020, MNRAS submitted, https://arxiv.org/abs/2003.08578
[2] Weisz D. R., et al., 2011, ApJ, 739, 5, https://arxiv.org/abs/1101.1093