

Estimating stellar dust attenuation from galactic spectra
The observed spectrum of a galaxy is a combination of several components: a continuum, absorption and emission lines. The continuum and absorption lines are both dominated by starlight, thus usually referred to as the stellar component of the spectrum. The emission-line component is produced in ionized Hydrogen (HII) regions around hot stars, or emission-line regions of active nuclei, or both. All these components, however, are modified by the attenuation of dust grains distributed in the inter-stellar space. Dust attenuation can affect galaxy spectra over a wide range of wavelengths, from ultraviolet (UV), optical to infrared, by absorbing short-wavelength photons in UV/optical and re-emitting photons in the infrared, and the absorption is stronger in shorter wavelength. Consequently, dust attenuation can cause changes in the overall shape of a galaxy spectrum. Such attenuation has to be taken into account before one can measure the different components of an observed spectrum reliably. Traditionally, dust attenuation is treated as a free parameter when fitting the spectrum with a stellar population synthesis model, and so it is hard to measure the dust attenuation given the well-known dust–age–metallicity degeneracy.
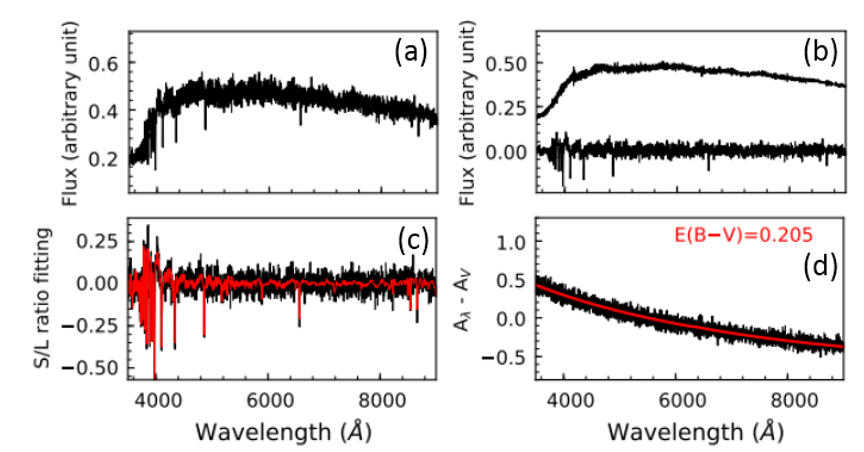
Recently, a collaboration led by Mr. Niu Li and Prof. Cheng Li from Department of Astronomy at Tsinghua University have developed a new technique to estimate the stellar dust attenuation which is free from the degeneracy between dust and other stellar properties. In this method, they first separate the small-scale features from the large-scale spectral shape, by performing a moving average method to both the observed spectrum and the simple stellar population model spectra. The intrinsic dust-free model spectrum is then derived by fitting the observed ratio of the small-scale to large-scale (S/L) components with the S/L ratios of the SSP models. The selective dust attenuation curve is then determined by comparing the observed spectrum with the dust-free model spectrum. One important advantage of this method is that the estimated dust attenuation curve is independent of the shape of theoretical dust attenuation curves. Figure 1 illustrates the method by showing an example fitting process.
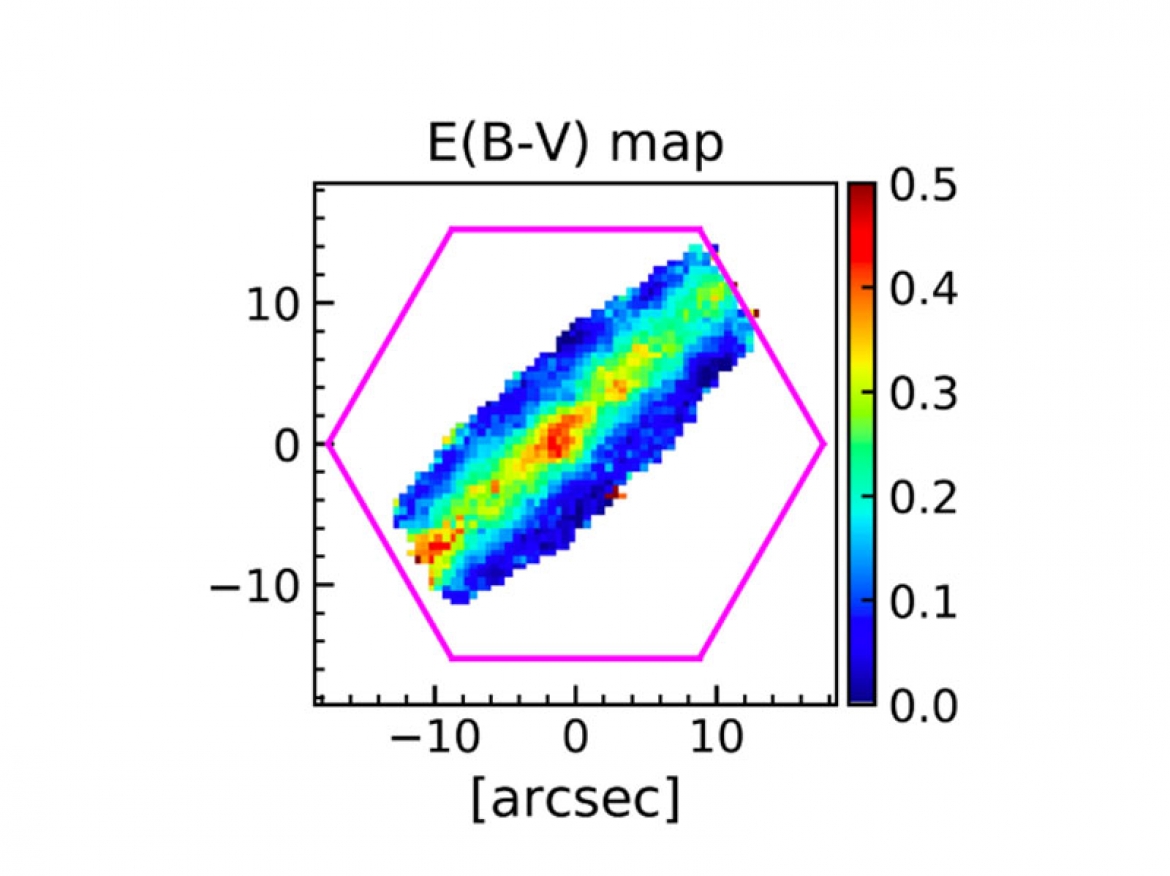
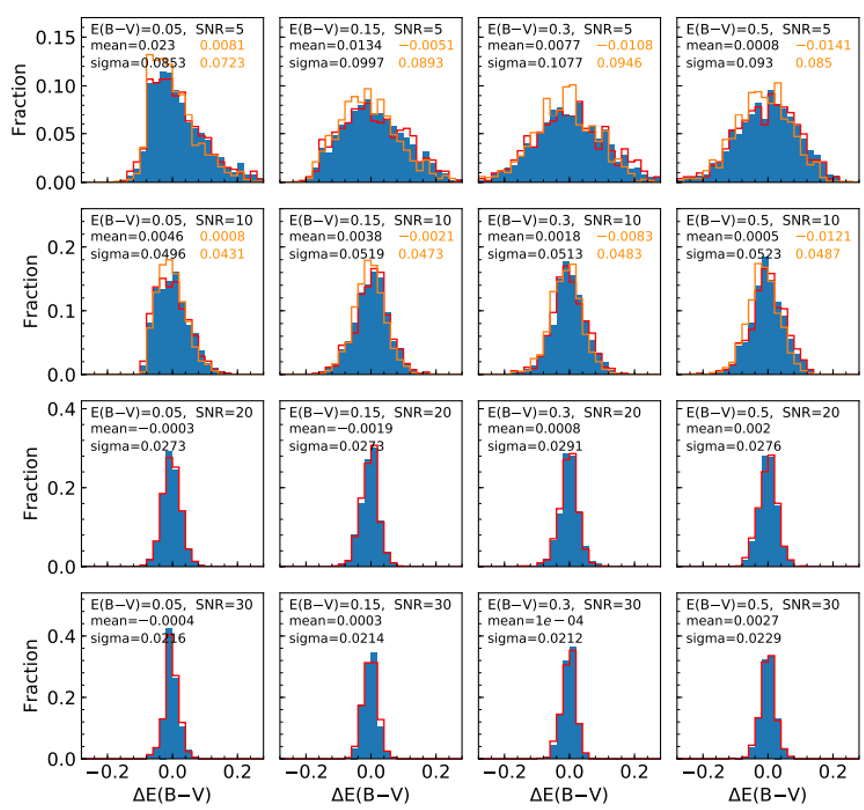
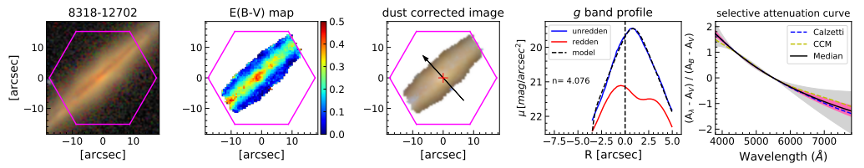
The team have done a series of tests on a set of mock spectra covering wide ranges of stellar age and metallicity. The results show that their method is able to recover the input dust attenuation accurately, although the accuracy depends slightly on signal-to-noise ratio of the spectra, as Figure 2 shows. They also applied their method to a number of edge-on galaxies with obvious dust lanes from the SDSS-IV/MaNGA survey, deriving their dust attenuation curves and E(B-V) maps, as shown in Figure 3. The dust lane features in the optical images largely disappear after the effect of dust attenuation is corrected using the measured E(B-V) map. Over the wavelength range probed, the median dust curves measured with their method lie between the Calzetti model and the Milky Way attenuation curves, which are commonly adopted in previous studies. However, there are spaxels where the recovered dust curves deviate significantly from both curves. The team is applying the method to measure E(B-V) maps and attenuation curves for all the galaxies in the MaNGA survey. These measurements will provide a statistical view of the stellar dust attenuation within different types of galaxies.
References:
[1] Niu Li, Cheng Li, et al., 2020, ApJ submitted, https://arxiv.org/abs/2001.02815