Molecular gas concentration driven by bars and interactions
Ryan Chown and Cheng Li
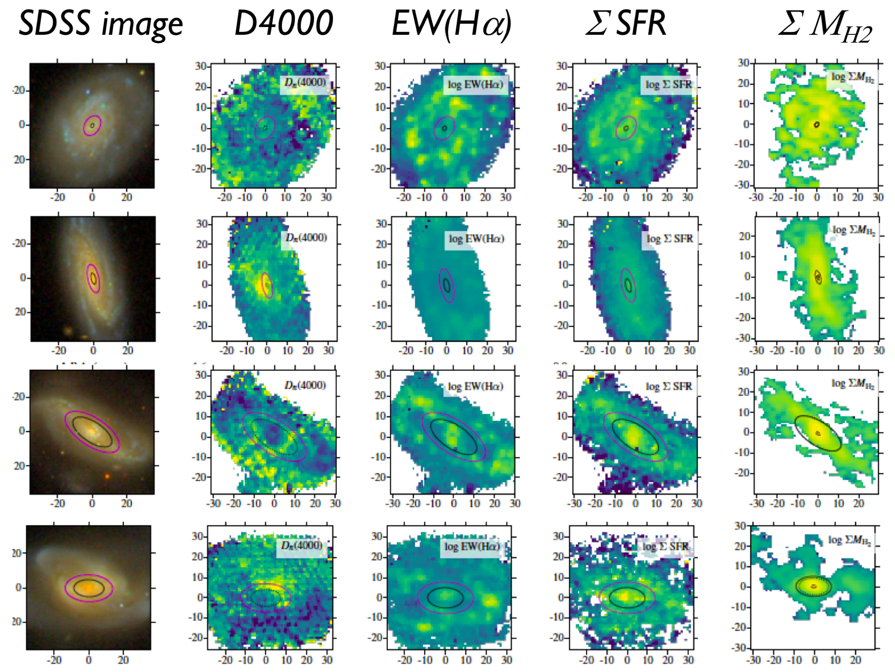
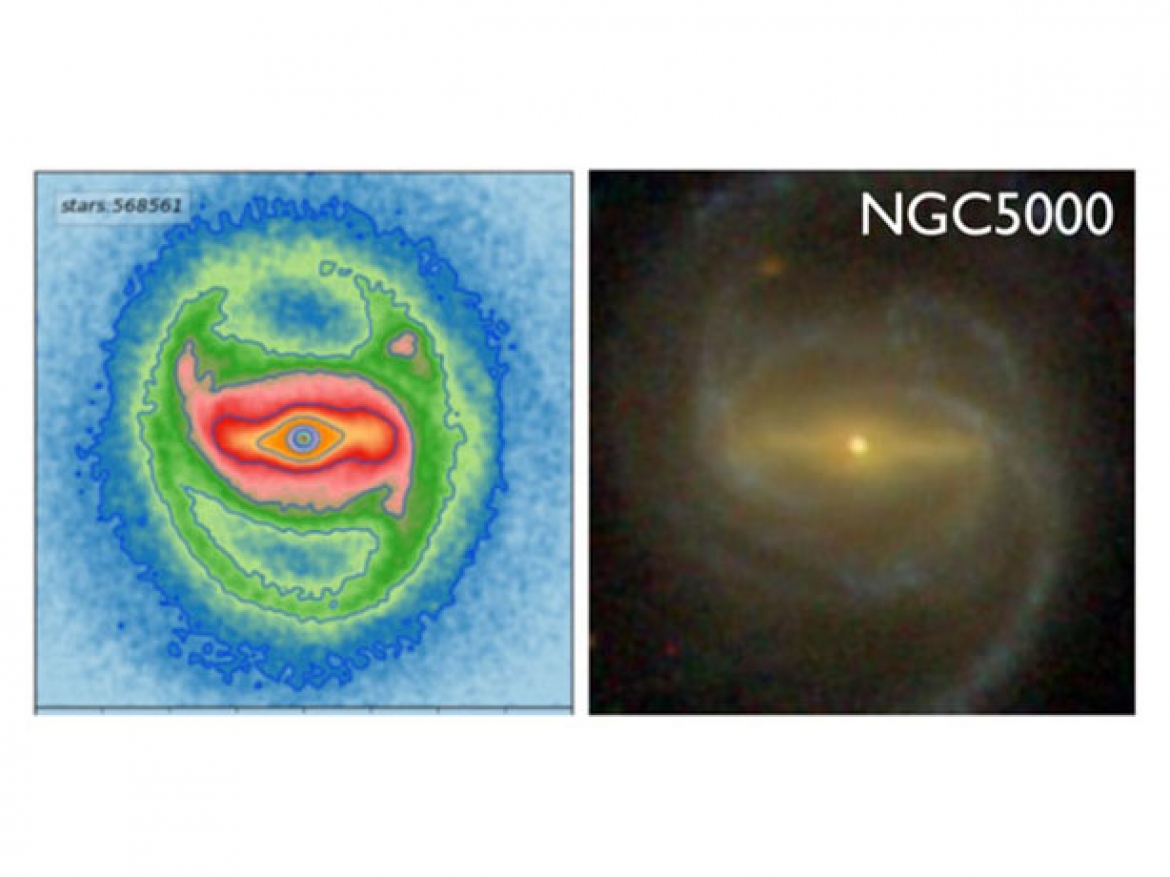
Theories of galaxy dynamics have long predicted that the bar-like structure in a galaxy may effectively transport gas from the outer disk to the central region through angular momentum exchange with the disk. Tidal forces from galaxy-galaxy interactions are predicted to produce a similar effect by driving gas inwards, where it forms stars in the central region. Both physical processes are believed to play important roles driving the formation and growth of the central bulge. A recent study at the THCA, led by Ryan Chown (visiting from McMaster U.), Prof. Cheng Li (Tsinghua), and Niu Li (Tsinghua) investigated the role of bars and interactions on both the molecular gas component of the interstellar medium and the star formation history of a sample of 64 nearby galaxies, and found clear evidence in support of this theoretical picture. The work makes use of spatially-resolved maps of 12CO 1-0 emission (2.2 mm wavelength) in these galaxies observed using the Combined Array for Research in Millimeter-wave Astronomy (CARMA) interferometer from the CARMA-EDGE survey (Bolatto et al. 2017), as well as optical integral field unit (IFU) data from the Calar Alto Legacy Integral Field Area (CALIFA) survey (Sanchez et al. 2016). Figure 1 shows maps of spectral features that are sensitive to recent star formation history, and those of molecular gas, for some example galaxies.
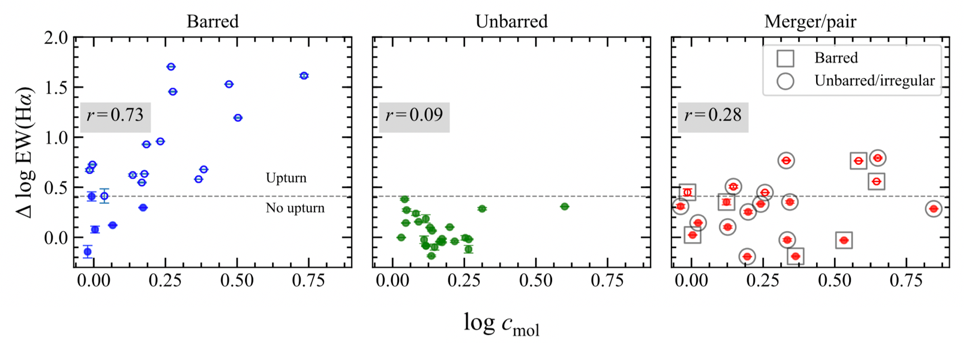
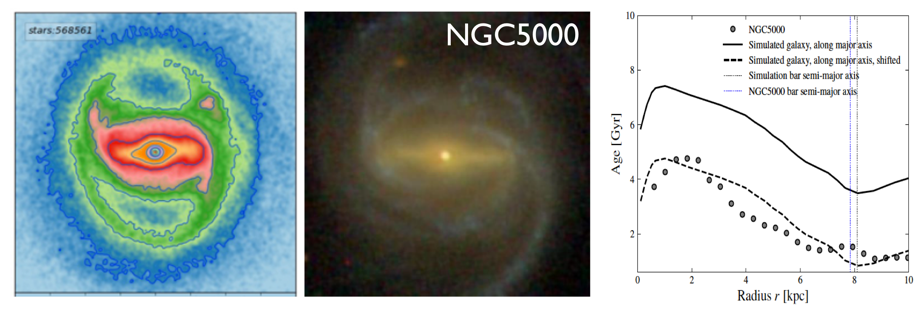
The authors found some galaxies show enhanced star formation in their centers, and these galaxies either host a bar structure or are in a pair/merging system (Figure 2). The level of enhanced star-formation in the innermost region is found to positively correlates with gas concentration for barred galaxies(Figure 3). In addition, the authors showed that the current N-body simulation of barred galaxies can well reproduce these observational result (Figure 4). Both the simulated and real galaxy show a central drop in stellar age, as well as a declining stellar age profile with increasing radius until the bar size, at which point the age increases again. This qualitative agreement between the simulation and observation shows that the current model of bar formation and evolution can qualitatively reproduce key properties of real galaxies.
References
Chown et al., 2018, submitted to MNRAS (https://arxiv.org/abs/1810.08624)
Bolatto et al. ApJ 846: 159 (2017).
Sanchez et al. A&A 594, A36 (2016).