

Quantifying the cosmic variance in low-z galaxy distribution
by Yangyao Chen and Cheng Li
Our Universe is not so homogeneous even at scales larger than hundreds of millions of light years . The properties of cosmic objects, which form and co-evolve with their environments, are also expected to be fluctuated in space. Limited by the sizes of telescopes, the astronomical observations are always constrained in restricted volume, and are not guaranteed to give an un-biased representation of the whole Universe. This inspires studies of such an effect known as cosmic variance (CV). Previous works have found that CV could have un-negligible effect for small surveys (e.g. pencil beam surveys [3], high-resolution shallow surveys [4], etc). Corresponding corrections have been made either in a statistical manner, or by a lowest-order assumption that the spatial distribution of bright and faint galaxies are much similar. However, these are far from enough to give a sample-to-sample quantifying of CV, and give a precise estimates of the statistics of galaxy distribution.
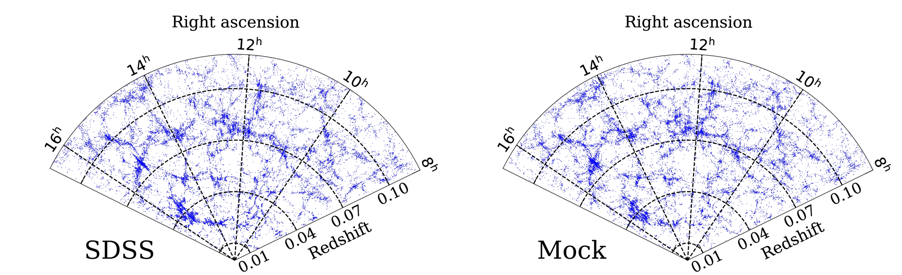
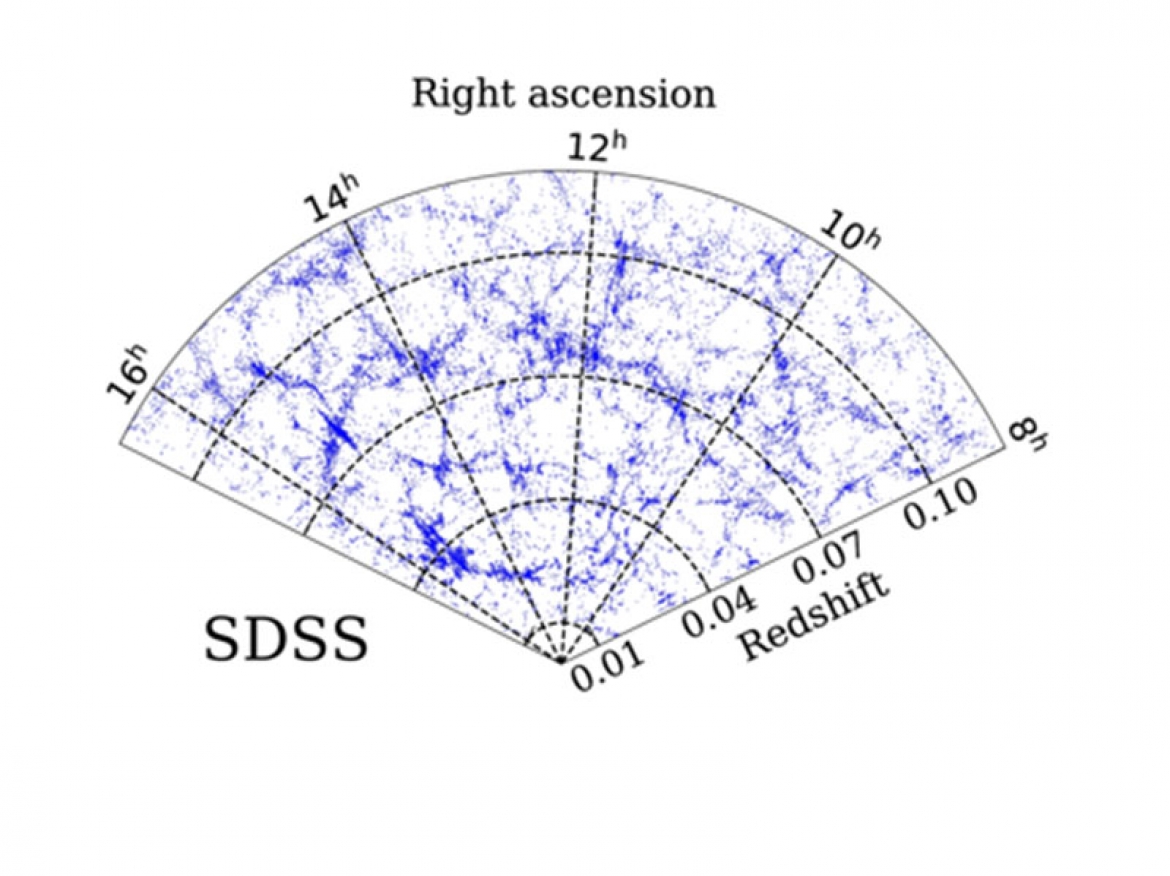
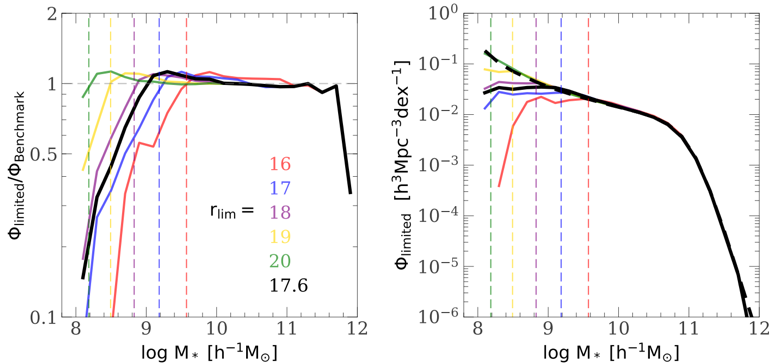
Recently, a collaboration group [1] led by Mr. Yangyao Chen and Prof. Cheng Li from Tsinghua Center for Astrophysics, in collaboration with the ELUCID team, have extensively investigated the cosmic variance in the Sloan Digital Sky Survey, the largest spectroscopic survey of low-z galaxies. Based on the local density field reconstructed from the ELUCID project [2], the team have implemented an empirical model of galaxy formation and conctructed a mock catalog for the SDSS galaxy sample. Large-scale structures, as well as small-scale distributions of galaxies are well reproduced in the mock catalog (Fig.1). An under-dense region below redshift 0.03 is clearly seen, which is expected to have considerable effect on the statistics of faint galaxies that can be observed only at the lowest redshifts. This catalog provides not only a fair sample that is free of CV, but also a set of biased samples with different selection effects that accurately represent the local Universe, thus is very suitable for quantifying the CV of the SDSS galaxy sample. Analysis of the mock catalog (Fig.2) shows that a shallower sample indeed produces a more obvious suppression of galaxy stellar mass function (GSMF) at the low-stellar-mass end. Only that with r-band magnitude limit as deep as -20 can give a fair estimate for GSMF down to 10^8 Msun/h. However, such a deep survey is not achievable in current observation.
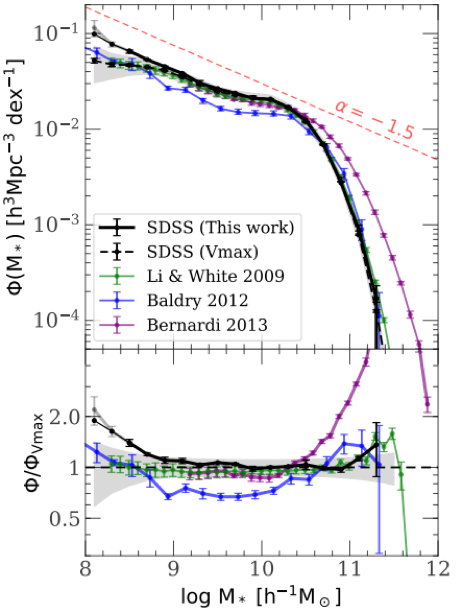
Furthermore, the team has proposed a new method to overcome the CV that appears at the low-stellar-mass end of the GSMF, by combining the halo mass function with the condition conditional GSMF, and applied this method to the SDSS data. The GSMF obtained this way (Fig.3), expected to be free of CV, presents a significant faint-end up-turn which is missed in all the earlier works based on traditional V-max method or other methods that cannot correctly handle CV. Importantly, many works of galaxy formation (e.g. hydrodynamic simulations, semi-analytic models, etc) may base on the observed GSMF. The new GSMF should in principle provide interesting constraints on models of galaxy formation, particularly the recipes of star formation feedback which are believed to be able to effectively shape the low-mass end of the mass function.
Link to relevant publications:
[1] Yangyao Chen, et al., 2018, ApJ submitted, https://arxiv.org/abs/1809.00523
[2] Huiyuan Wang, et al. 2016, ApJ, https://arxiv.org/abs/1608.01763
[3] Benjamin P. Moster, et al. 2010, ApJ, http://arxiv.org/abs/1001.1737
[4] Ivan K. Baldry, et al. 2012 MNRAS, https://arxiv.org/abs/1111.5707