

Rotation inferred from proper motions of RR Lyraes in the Galactic bulge
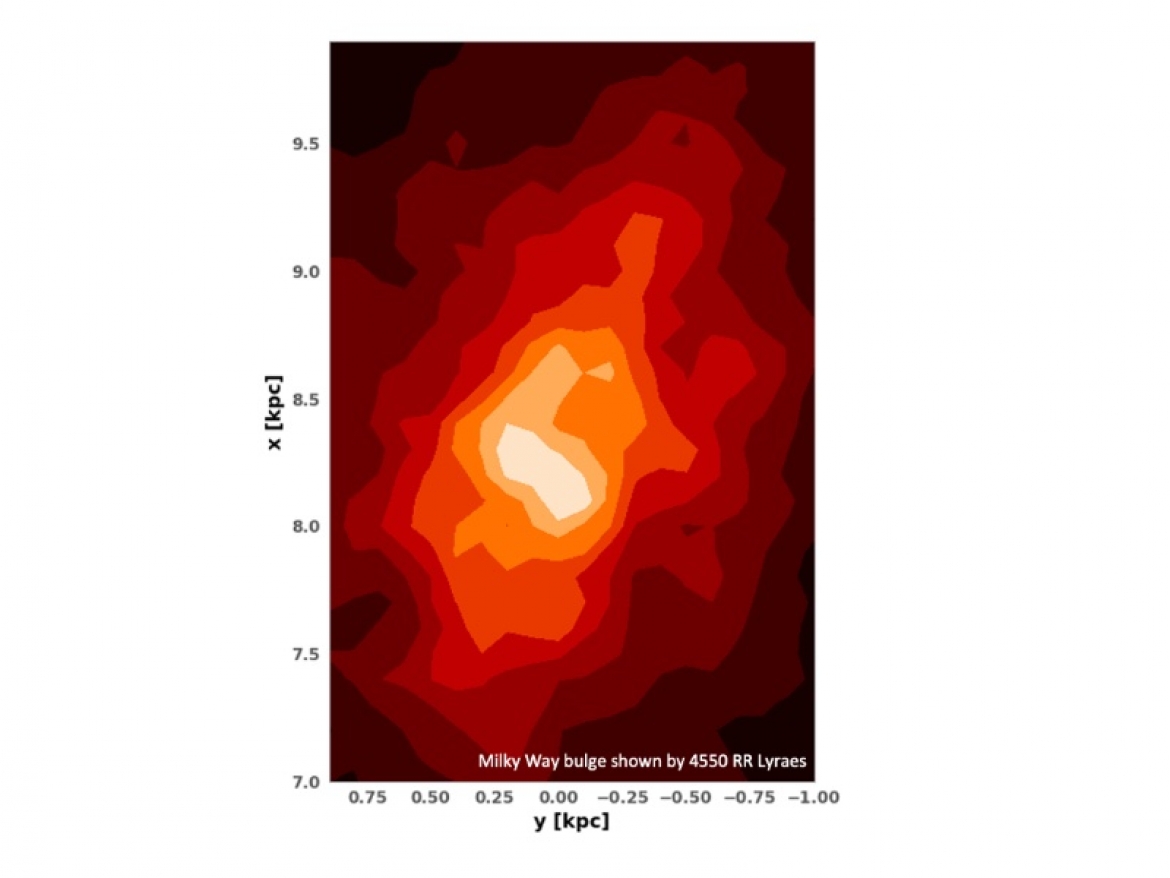
RR Lyrae stars are pulsating, low-metallicity, core-helium-burning horizontal branch giants with ages older than 10 Gyr. Their period-luminosity relation allows their distances to be determined accurately, which enables us to study their spatial distribution and kinematics.
Hangci Du, a master student from the Department of Astronomy of Tsinghua University, together with Dr. Shude Mao (Tsinghua University), E. Athanassoula (Aix Marseille Université), Juntai Shen (Shanghai Jiaotong University) and Pawel Pietrukowicz (University of Warsaw) used a sample of 15,599 RR Lyrae stars from the OGLE-IV bulge RR Lyrae catalogue cross-matched with the GAIA DR2. They developed a method to use proper motions and radial velocities equivalently as bulge rotation indicators; earlier studies only used radial velocity data. They find that RR Lyrae (RRL) stars rotate slower than younger populations, and that the fraction of bulge RRLs belonging to the halo is lower than expected. They also find that bulge RR Lyraes with lower metallicities rotate slower, have higher velocity dispersions and exhibit a smaller bar angle with the line of sight compared with those with higher metallicities. These new constraints offer important clues on the formation history of the Galactic bulge.

Reference:
Du et al. (2020), arXiv:2007.01102 (MNRAS, accepted)
Kunder, A., Koch, A., Rich, R. M., et al. 2012, AJ, 143, 57
Sanders, J. L., Smith, L., Evans, N. W., et al. 2019, MNRAS, 487, 5188